Snowball
Snowball (5,220 + DIP)
5/220 trend trading combined with 52-week-high drawdown buys — turning bear markets into accumulation.
How it works
The skeleton is a TQQQ 5×220-day golden/dead cross: all-in on golden, all-out on dead. But instead of idling through downtrends, it buys dips off QQQ’s 52-week high: at −10%, a first buy (30% if TQQQ RSI-14 ≤ 35, else 20%); at −22%, another 50%; below −40%, new buying stops. On the way up it de-risks by profit bands: keep 50% at +15%, 35% at +68%, and “graduate” to 15% at +350%. Defaults follow the published Horiori settings and are adjustable in the app.
32.4%
10y CAGR (sim)
-53.5%
Max drawdown (sim)
Signal & traded assets
| Signal (chart) | TQQQ · 5×220-day SMA + QQQ 52-week-high drawdown · TQQQ RSI(14) |
|---|---|
| Traded asset | TQQQ (3x Nasdaq, ratio-managed) |
| Parked after sell | SGOV (short-term treasuries) |
Rules
| Trend | TQQQ 5×220-day — golden = all-in, dead = all-out |
|---|---|
| DIP buys | QQQ vs 52w high −10%: 20% (30% if RSI≤35) / −22%: +50% / below −40%: stop |
| Profit bands | +15% → keep 50% / +68% → 35% / +350% → 15% (graduate) |
| Defaults | Published Horiori values — adjustable in the app |
Charts on real data
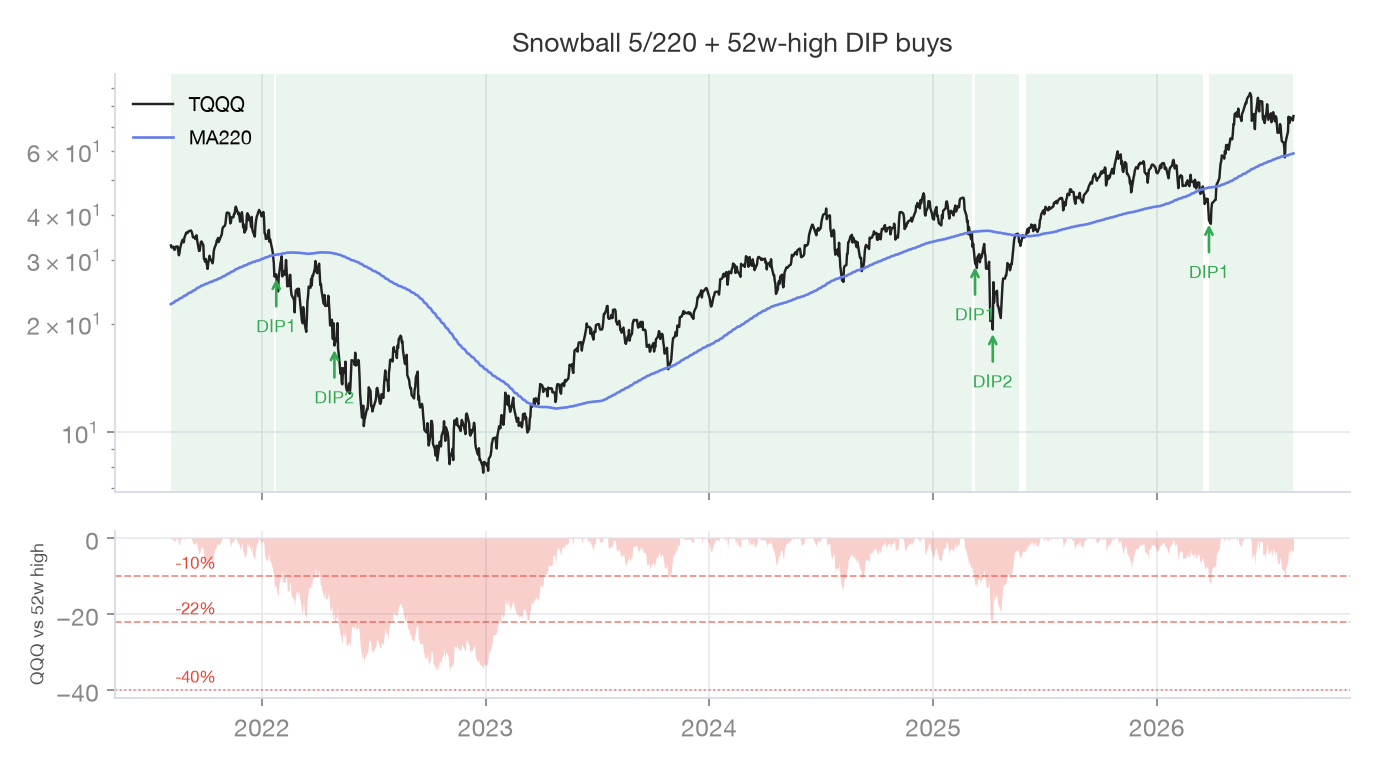
Last 5 years · green shading = holding periods
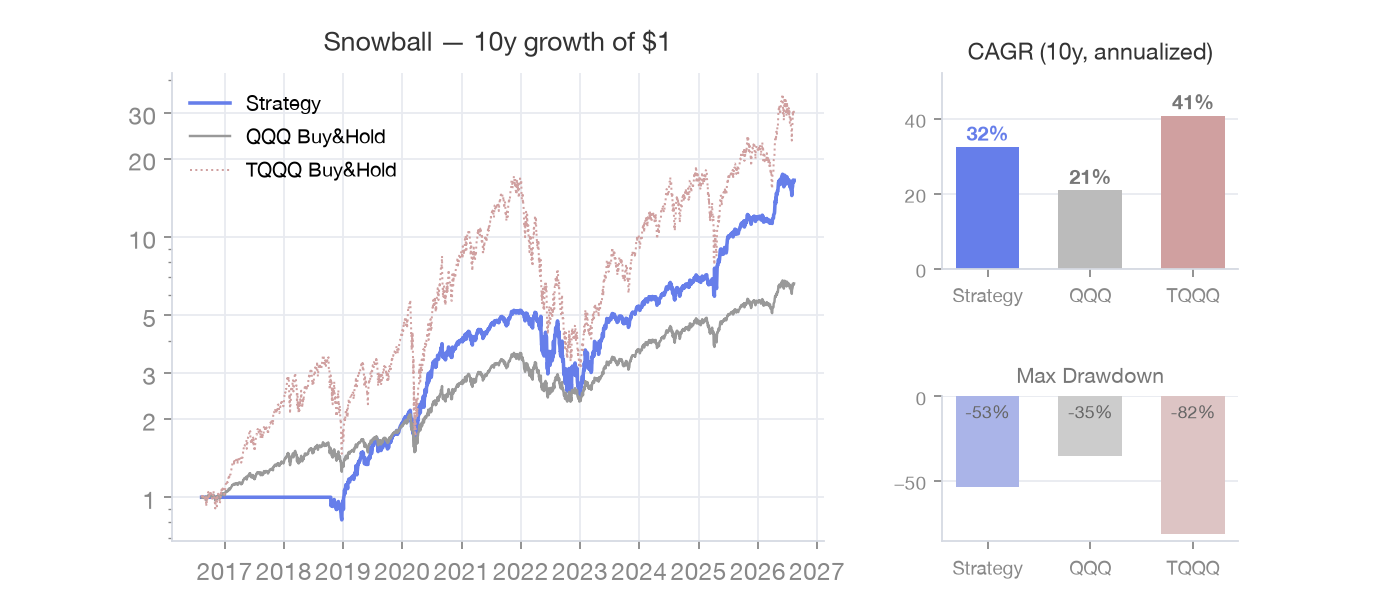
Last 10 years · growth of $1 (no taxes/fees)
FAQ
- Why buy during downtrends in a trend strategy?
- Deep drawdowns are statistically favorable zones; small staged buys lower the average cost so the next golden cross compounds harder. The −40% stop is the systemic-risk line.
- Feels painful to trim winners?
- The bands cut equity-curve volatility and define an explicit “graduation” — protecting long-term compounding. Ratios are adjustable in-app.
- What if a dead cross comes after DIP buys?
- Sell everything, DIP shares included — no exceptions. Losses can happen, but together with the stop below −40% this bounds systemic risk.
- What is "graduation"?
- At +350% profit the strategy locks in gains, keeping only 15%. It explicitly ends one cycle and waits for the next signal — defining an ending is what protects long-term compounding.
Sources
Backtest charts on this page reproduce the app’s rules on Yahoo Finance daily data (last 10 years,
adjusted closes) for reference only. Taxes, fees and slippage are not modeled, and past performance does not
guarantee future results. Rule descriptions and live signals always follow the app’s latest implementation.
Nothing here is investment advice; decisions and responsibility remain yours.
Enable this strategy in the app → Settings · Strategy© 2026 FatTail Labs. All rights reserved.
문의/Contact: fattaillabs.ceo@gmail.com
문의/Contact: fattaillabs.ceo@gmail.com