Classic
Original 200-day SMA
The strategy the app is named after. One single reference: TQQQ’s own 200-day SMA.
How it works
When TQQQ closes above its own 200-day SMA (golden cross), sell SGOV and buy TQQQ; when it closes below (dead cross), exit TQQQ and the S&P ETF into SGOV. It uses TQQQ’s own moving average rather than the index because the original author’s tests showed fewer whipsaws and better returns. While overheated (above the +5% envelope), new money parks in the S&P ETF instead.
32.0%
10y CAGR (sim)
-50.0%
Max drawdown (sim)
Signal & traded assets
| Signal (chart) | TQQQ itself · 200-day SMA |
|---|---|
| Traded asset | TQQQ (3x Nasdaq) |
| Parked after sell | SGOV (short-term treasuries) |
| New money when overheated | S&P ETF (default SPYM) |
Rules
| Buy | TQQQ closes above its 200-day SMA → sell SGOV, buy TQQQ |
|---|---|
| Sell | TQQQ closes below the 200-day SMA → sell TQQQ & S&P ETF, buy SGOV |
| Overheat | Above the +5% envelope, new money goes to the S&P ETF |
| Profit-taking | Optional ladder: sell 10% at +10/+25/+50%, then 50% of the rest at every +100% multiple |
Charts on real data
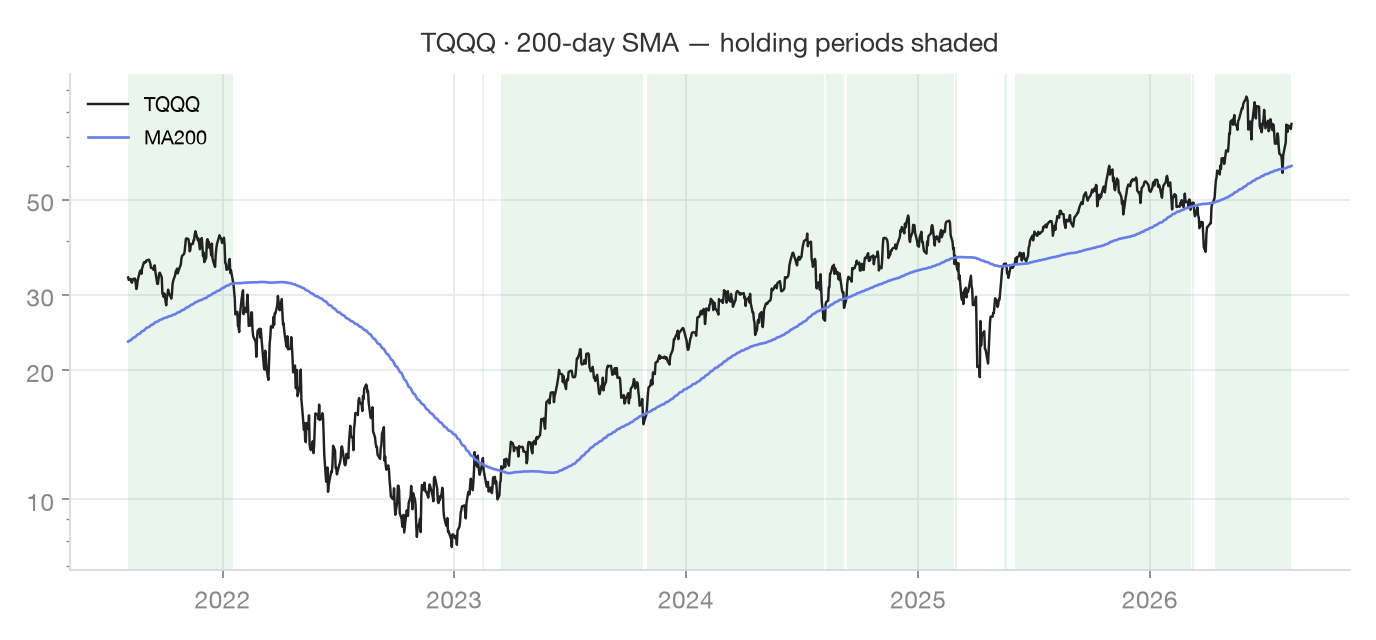
Last 5 years · green shading = holding periods
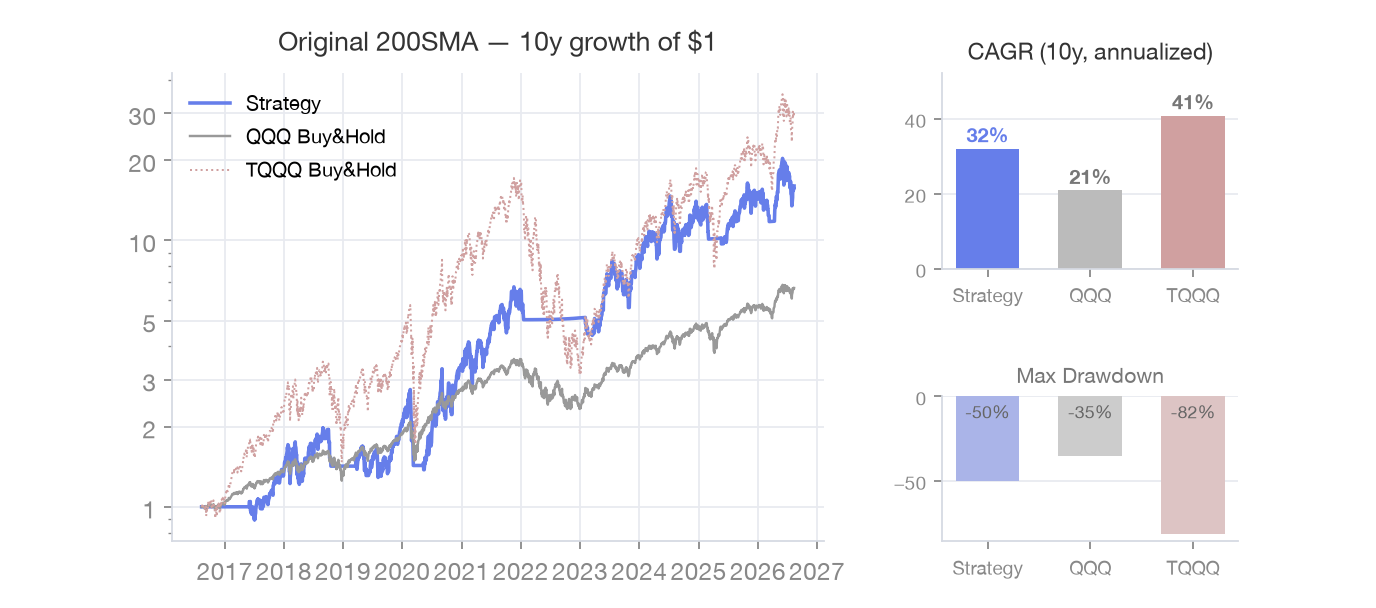
Last 10 years · growth of $1 (no taxes/fees)
FAQ
- Why TQQQ’s own SMA instead of QQQ’s?
- In the author’s backtests it produced fewer crossovers and better results — the 3x volatility baked into the average makes signals more conservative.
- Worried about whipsaws?
- Consider the QQQ 3/161 (fewer whipsaws) or TQQQ 5/218 (fewer trades) variants below, or enable 2–3 signal-confirmation days in the app.
- When do I check and trade?
- Once a day, on the closing price. The app computes signals on the close; executing the next trading day is fine. Not reacting to intraday moves is the point — that is where the "peace of mind" comes from.
- If I start today, do I buy immediately?
- Just follow the rules for the current state: below the 200-day line, wait in SGOV; in the focus band, buy; if overheated, park new money in the S&P ETF and wait for the next focus band. Never needing to ask "is this the bottom?" is the design.
Sources
Backtest charts on this page reproduce the app’s rules on Yahoo Finance daily data (last 10 years,
adjusted closes) for reference only. Taxes, fees and slippage are not modeled, and past performance does not
guarantee future results. Rule descriptions and live signals always follow the app’s latest implementation.
Nothing here is investment advice; decisions and responsibility remain yours.
Enable this strategy in the app → Settings · Strategy© 2026 FatTail Labs. All rights reserved.
문의/Contact: fattaillabs.ceo@gmail.com
문의/Contact: fattaillabs.ceo@gmail.com